PlotGround: Grounding Plot Digitization in Real Scientific Figures and Their Source Data
How accurately can frontier multimodal models read numbers off real scientific figures? PlotGround is an automated pipeline for building plot digitization benchmarks from real scientific figures and their source data. With it we construct PlotGround-1k, 1,119 human-verified questions from 1,066 bioRxiv preprints, and evaluate 16 models.
Yaohui Zhang*, Binxu Li*, Haoyi Duan*, Jiacheng Miao, Yixin Wang, Xinran Du, Chenyue Li, Shilong Liu, Kevin Wu, James Zou (*co-first authors)
- research
- benchmark
 arXiv ↗
 Dataset ↗
What is PlotGround?
Plot digitization is the task of reading numbers off a chart: the height of a bar, the median of a box, the y-value of a labeled point. For a model to be useful to scientists, it has to do this on the figures scientists actually publish, which are dense, multi-panel, and messy. But to score a model on a real figure, you need to know the true value behind every mark, and the image alone can’t tell you that.
PlotGround gets that answer from the paper itself. Many preprints deposit the data behind their figures as supplementary tables. PlotGround links a plotted value back to the exact rows that produced it, writes down the operation that turns those rows into the plotted number, and recomputes it. The reference answer comes from the source data, not from someone eyeballing the image.
Here is one of the benchmark’s line-plot questions:
The model sees the published figure. The question picks out one plotted value using only labels visible in it: the DosR point at 2 µM.
| Series | [Protein] | Rate |
|---|---|---|
| DosR | 1.5 | … |
| DosR | 2 | 6.81 |
| DosR | 2 | 5.37 |
| DosR | 2 | 5.94 |
| DosR | 3 | … |
| PknH-DosR | 2 | … |
The figure is linked to the paper's deposited source table, and the replicate rows behind the point are located. Rows shown here are illustrative.
- Select rows:
Series = DosR,[Protein] = 2 - Aggregate:
mean(Rate)
A prediction is correct if it falls within a relative-error tolerance of the recomputed value. An answer of 6.20 is 2.6% off: correct at ±5%, wrong at ±2%.
Every question in PlotGround-1k is built this way, across 10 chart types including bar, volcano, scatter, box, line, bubble, strip, and survival plots. Questions name their target only with labels visible in the figure, and models answer from the figure alone.
Leaderboard
Each model sees the full figure and a question targeting one plotted value, and answers from the figure alone. Accuracy is the share of predictions within a relative-error tolerance of the source-grounded reference value. Tightening the tolerance from ±5% to ±2% costs every model between 11 and 24 points.
| Rank | Model | Developer | Acc. ±5% ↓ | Δ ±5→±2 |
|---|---|---|---|---|
| 1 |  GPT-5.6 Sol | OpenAI | 87.5 | −13.7 |
| 2 | GPT-5.6 Luna | OpenAI | 83.8 | −14.1 |
| 3 | GPT-5.6 Terra | OpenAI | 82.1 | −15.5 |
| 4 |  Gemini 3.7 Flash | 81.2 | −15.5 | |
| 5 | Gemini 3.8 Flash | 79.8 | −14.3 | |
| 6 |  Qwen3.8 Max | Alibaba | 77.9 | −20.2 |
| 7 |  Claude Opus 5 | Anthropic | 77.1 | −16.9 |
| 8 | Claude Sonnet 5 | Anthropic | 74.4 | −18.8 |
| 9 | Gemini 3.1 Pro | 67.6 | −17.7 | |
| 10 | Qwen3.8 Flash | Alibaba | 64.4 | −21.8 |
| 11 |  Kimi K3 | Moonshot | 62.5 | −24.3 |
| 12 |  GLM-5.3 Flash | Z.ai | 60.2 | −20.4 |
| 13 |  Inkling | Thinking Machines | 50.3 | −18.3 |
| 13 |  MiniMax M3 | MiniMax | 50.3 | −16.5 |
| 15 |  DeepSeek V4.1 Flash | DeepSeek | 47.0 | −17.7 |
| 16 | DeepSeek V4 FV exp | DeepSeek | 28.6 | −11.6 |
The PlotGround Pipeline
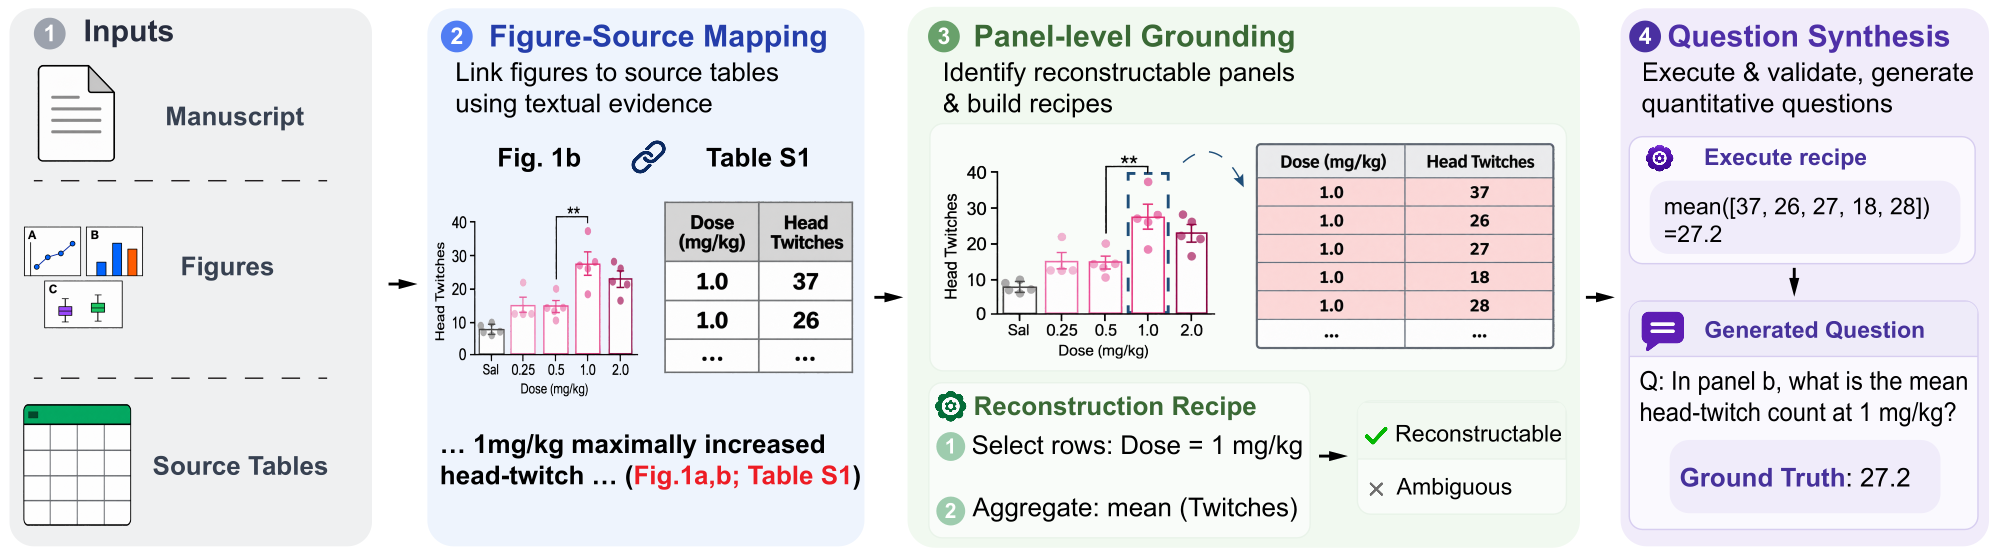
Instead of rendering synthetic charts from data, PlotGround starts from real figures and works backward to ground each plotted value in its source data.
- Step 1Mapping
Bind each figure to candidate supplementary tables using direct evidence (explicit references in text) or indirect evidence (figure descriptions matching table contents).
- Step 2Grounding
Keep only panels whose values can be recovered with simple operations such as selection, aggregation, ratios, or log transforms, and record a reconstruction recipe anchored to literal evidence.
- Step 3Synthesis
Execute the recipe, sanity-check the recomputed values, and write at most two questions per figure using only figure-visible labels.
Benchmark Examples
Models receive the complete multi-panel figure. Each question names its target only with identifiers visible in the figure; the answer is recomputed from the deposited source table.
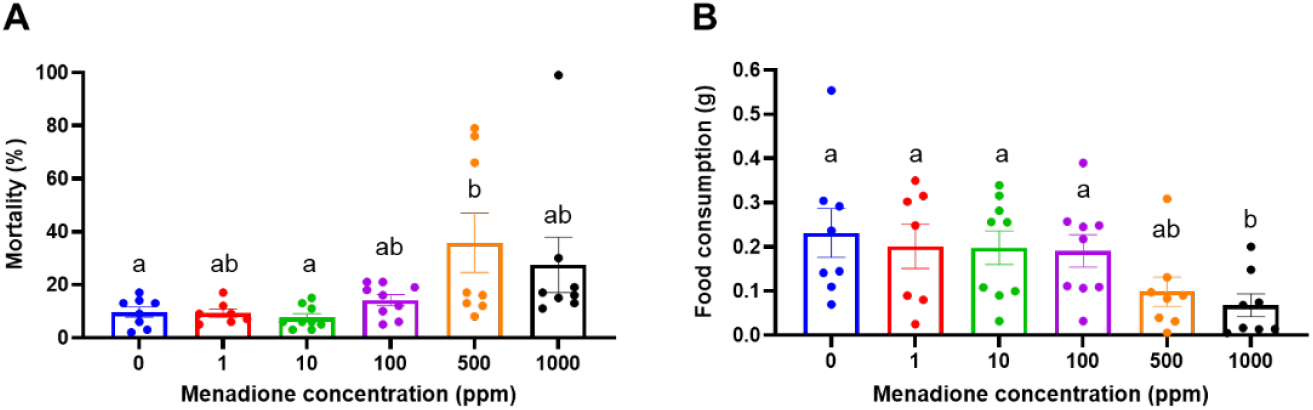
Correct if the prediction is within ±5% (or ±2%) relative error of this value. The value is recomputed from the paper's deposited source table, not read from the image.
Figure–Data Discrepancies
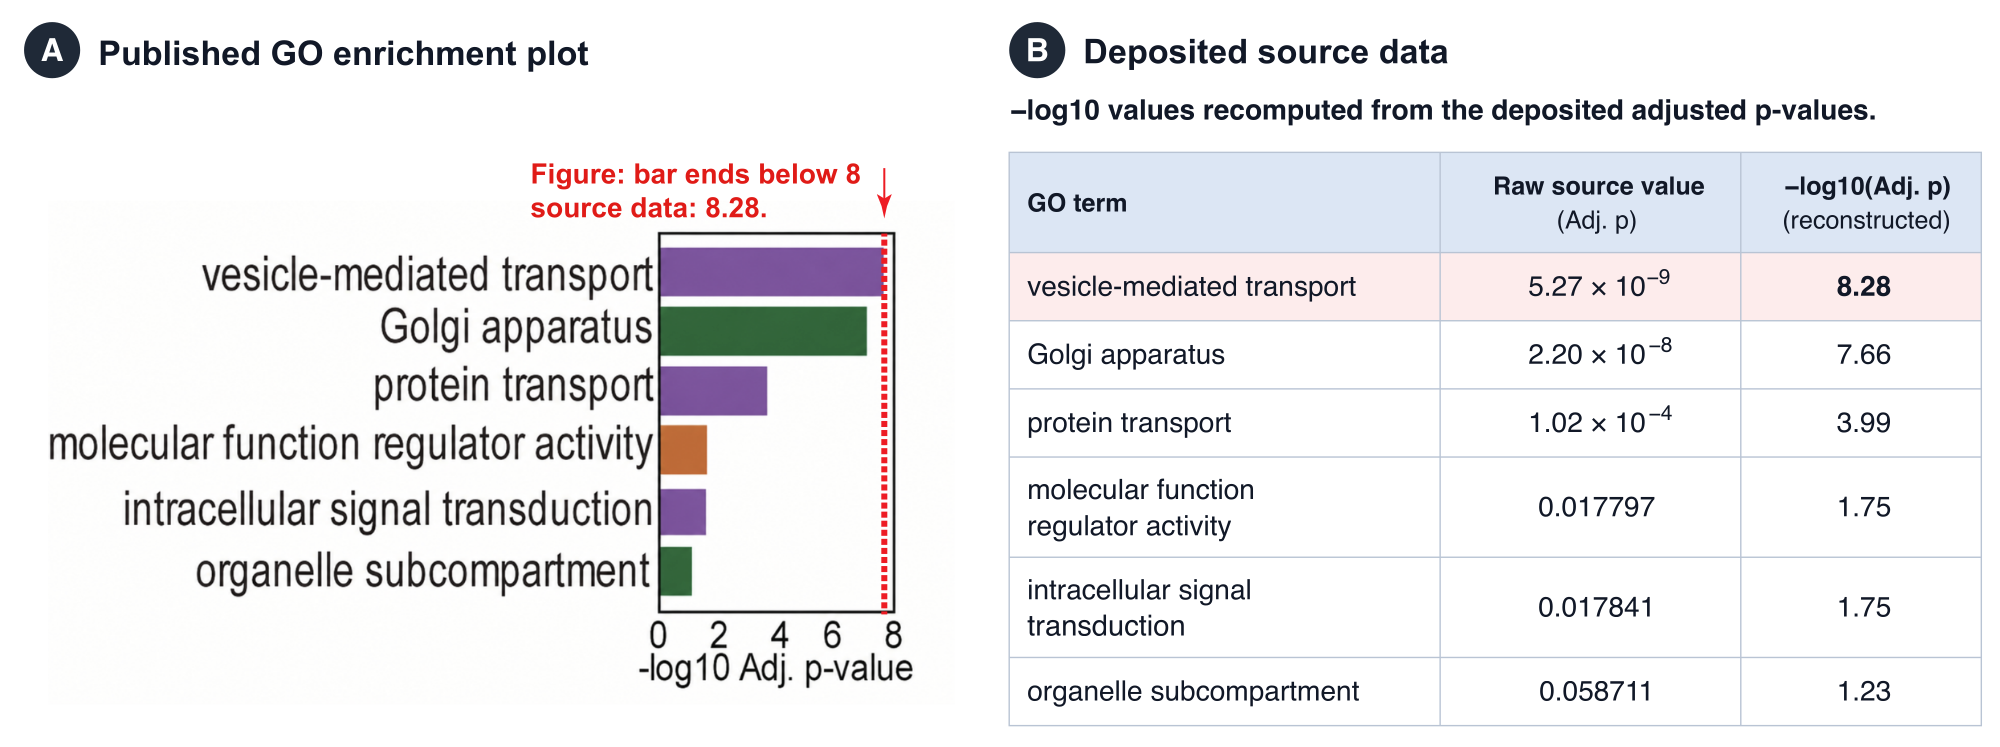
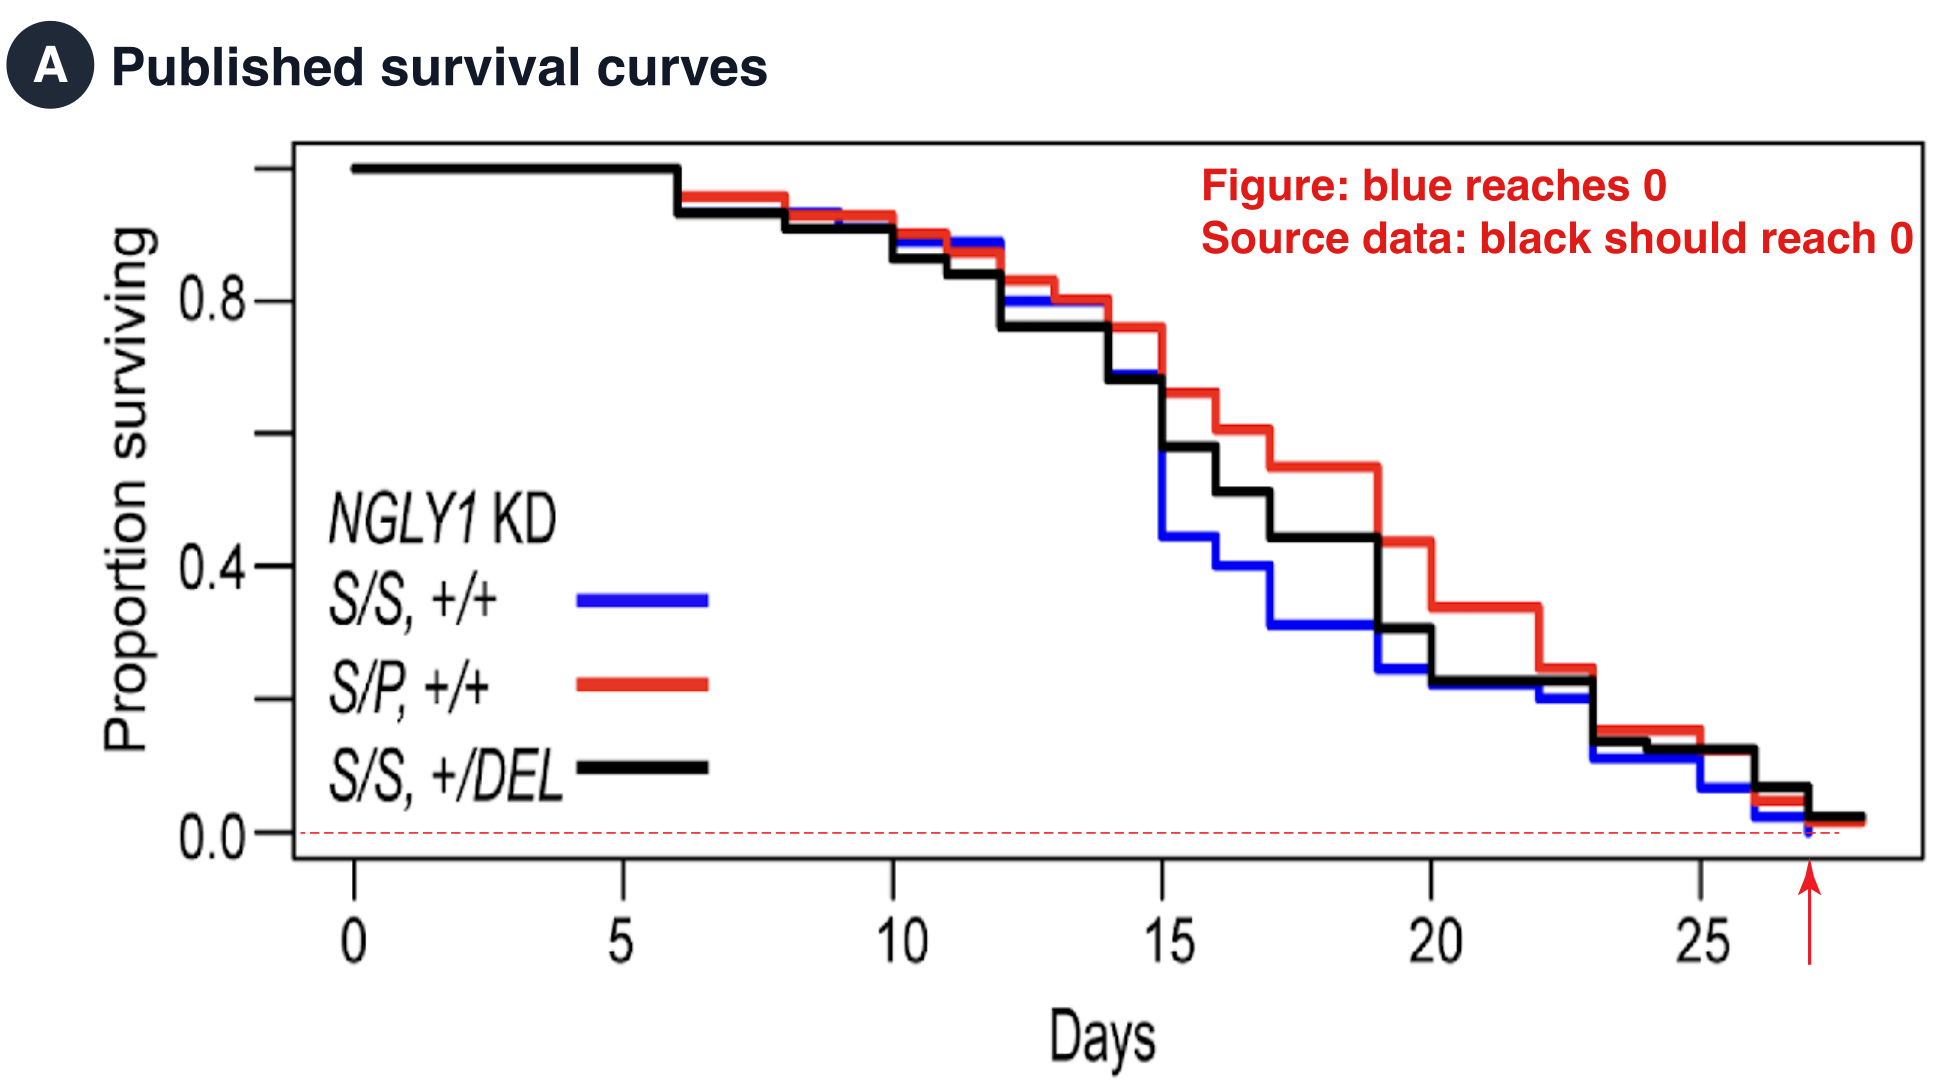
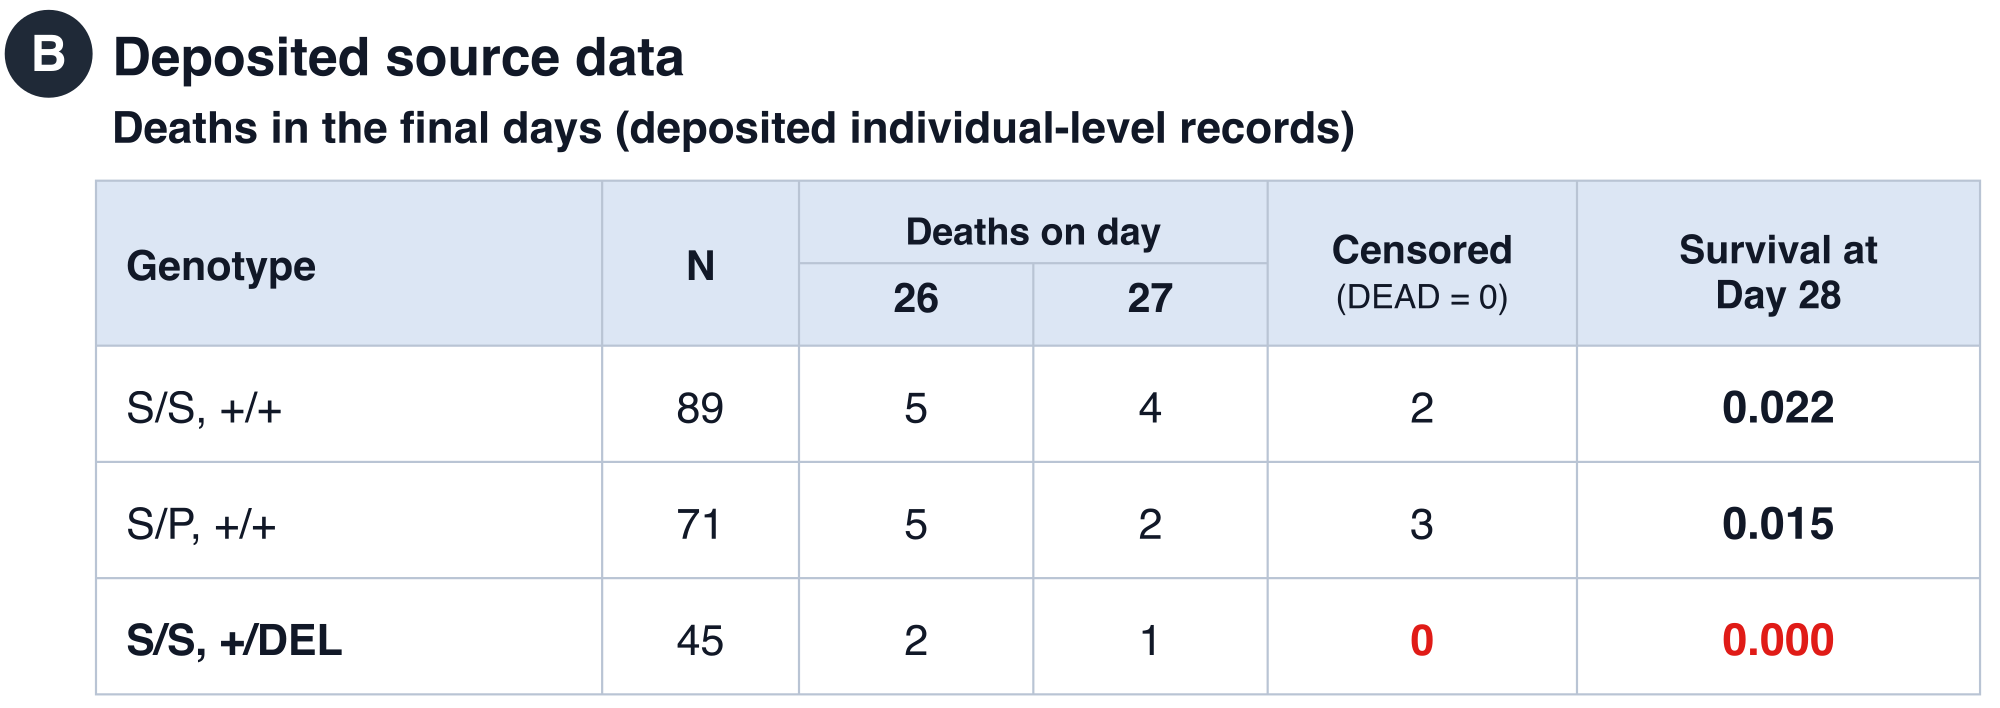
During human verification, we found 8 figures whose plotted values disagree with their own source data. GPT-5.6 Sol, the top model on our leaderboard (87.5% at ±5%), read all 8 values as plotted, suggesting that frontier models could help flag such inconsistencies.
Cite PlotGround
If you find PlotGround useful in your research, please cite our work.
@misc{zhang2026plotgroundgroundingplotdigitization,
      title={PlotGround: Grounding Plot Digitization in Real Scientific Figures and Their Source Data},
      author={Yaohui Zhang and Binxu Li and Haoyi Duan and Jiacheng Miao and Yixin Wang and Xinran Du and Chenyue Li and Shilong Liu and Kevin Wu and James Zou},
      year={2026},
      eprint={2610.06825},
      archivePrefix={arXiv},
      primaryClass={cs.CL},
      url={https://arxiv.org/abs/2610.06825},
}